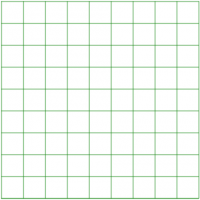
示例基础代码
用canvas画一个9*9的表格
(function(global) {
    'use strict';

    function _extend(obj1, obj2) {
        for (var i in obj2) {
            if (obj2.hasOwnProperty(i)) {
                obj1[i] = obj2[i];
            }
        }
    }

    function GridFunny(options) {
        this.grid = {};
        this.gridOfX = {};
        this.gridOfY = {};
        this.settings = {
            container: document.body,
            gridColor: "#ccc", // 格子的颜色
            gridNum: 9, // 格子的数量
            canvasSize: {
                width: 500,
                height: 500
            }, // canvas的尺寸
            generateGridKey: function(x, y) {
                return [x, y].join("-");
            }, // 创建每个格子在grid对象中的key
            onDraw: function() {

            }, // 提供绘画钩子方法,方便定制绘画
            fillGrid: function(keyX, keyY, pixelX, pixelY) {

            }, // 填充每个格子内容的方法
            contextType: "2d", // canvas文本类型(2d或者3d)
            border: 1 // 表格的边框大小
        };
        _extend(this.settings, options || {});
        return this;
    }

    GridFunny.prototype.start = function() {
        this.canvas = this._initCanvas();
        this.context = this.canvas.getContext(this.settings.contextType);
        this._drawBoard();
    }

    GridFunny.prototype._initCanvas = function() {
        var canvas = document.createElement("canvas");
        canvas.width = this.settings.canvasSize.width;
        canvas.height = this.settings.canvasSize.height;
        this.settings.container.appendChild(canvas);
        return canvas;
    }

    GridFunny.prototype._drawBoard = function() {
        var width = this.settings.canvasSize.width,
            height = this.settings.canvasSize.height,
            num = this.settings.gridNum,
            border = this.settings.border,
            halfBorder = border / 2,
            context = this.context,
            color = this.settings.gridColor,
            pixelX = (width - border) / (num + 2),
            pixelY = (height - border) / (num + 2),
            rectXSize = pixelX * (num + 1),
            rectYSize = pixelY * (num + 1);
        context.clearRect(0, 0, width, height);
        context.beginPath();
        /* 垂直线 */
        for (var i = 0, x = pixelX; x <= rectXSize; x += pixelX) {
            i++;
            var beginCoordinate = halfBorder + x;
            if (i <= num) this.gridOfX[i] = beginCoordinate;
            context.moveTo(beginCoordinate, pixelX);
            context.lineTo(beginCoordinate, rectXSize);
        }

        /* 水平线 */
        for (var j = 0, y = pixelY; y <= rectYSize; y += pixelY) {
            j++;
            var endCoordinate = halfBorder + y;
            if (j <= num) this.gridOfY[j] = endCoordinate;
            context.moveTo(pixelY, endCoordinate);
            context.lineTo(rectYSize, endCoordinate);
        }
        this._initGridCoordinate(pixelX, pixelY);
        context.closePath();
        this.settings.onDraw.call(this);
        /* 开始画 */
        context.strokeStyle = color;
        context.stroke();
    }

    GridFunny.prototype._initGridCoordinate = function(pixelX, pixelY) {
        var context = this.context,
            grid = this.grid,
            gridOfX = this.gridOfX,
            gridOfY = this.gridOfY;
        for (var keyX in gridOfX) {
            for (var keyY in gridOfY) {
                // 记录每个格子的坐标
                var key = this.settings.generateGridKey(keyX, keyY);
                grid[key] = [gridOfX[keyX], gridOfY[keyY]];
                this.settings.fillGrid.call(this, keyX, keyY, pixelX, pixelY);
            }
        }
    }

    // Export Pig into the global scope.
    if (typeof define === 'function' && define.amd) {
        define(function() {return GridFunny;});
    } else if (typeof module !== 'undefined' && module.exports) {
        module.exports = GridFunny;
    } else {
        global.GridFunny = GridFunny;
    }

}(this));
var grid = new GridFunny({
    gridColor: "green"
});
grid.start();
主要用到的方法:
- clearRect(x, y, width, height):清空所选矩形块
- beginPath:开始绘制路径
- moveTo(x, y):将画笔移到坐标为(x, y)的地方
- lineTo(x, y):画一条到坐标(x, y)为止的线
- closePath:结束绘制路径
- strokeStyle:给画笔添加颜色(通俗的说法是给画笔加所给颜色的墨水),示例中默认是灰色#ccc
- stroke:根据绘制的路径以及定义的颜色,绘制图画
